Government Securities.Simplified.
Explore Treasury bill markets, compare yields, build investment strategies, and manage your government securities portfolio through one intelligent platform.
A demonstration. The rates and auction results are official. The portfolio, orders and balances are simulated. No real money or securities are involved.
GetTbill Markets US Treasury bills
Delayed official ratesBill curve, bank discount rate
| Bill | Matures | Days | Reference rate |
|---|---|---|---|
| 912797VA2 | Dec 3, 2026 | 27 | 3.89% |
| 912797VV6 | Feb 4, 2027 | 90 | 3.99% |
| 912797WX1 | May 6, 2027 | 181 | 4.07% |
| 912797WT0 | Oct 28, 2027 | 356 | 4.08% |
Treasury market overview
Where bills stand today
Every published bill rate in one view, with no sign-in. Figures come from the latest official publications.
- 4-week
- 3.89%3.96% coupon eq.
- 6-week
- 3.91%3.98% coupon eq.
- 8-week
- 3.98%4.06% coupon eq.
- 13-week
- 4.00%4.10% coupon eq.
- 17-week
- 4.05%4.16% coupon eq.
- 26-week
- 4.08%4.22% coupon eq.
- 52-week
- 4.09%4.28% coupon eq.
Through the trading day
See live charts for bills, bonds and stocks- Curve slope, 4-week to 52-week
- +20.0 bpThe 52-week rate minus the 4-week rate. Observed Nov 5, 2026.
- Latest auction result
- 3.890%4-Week high rate, Nov 5, 2026. Bid-to-cover 2.46.
- Next announced auction
- USD 95 billion13-Week offering, auction Nov 9, 2026.
How GetTbill works
Official data first, simulation on top
- Step 1
Read official data
Daily bill rates and auction results are collected from government publications, with the observation date and source kept on every figure.
- Step 2
Compare and analyze
See the curve, how it changed against any earlier date, and how other markets quote their bills, with conventions stated.
- Step 3
Model a strategy
Price a single bill, split capital across maturities, and see when each amount comes due before committing simulated funds.
- Step 4Simulated
Run a simulated portfolio
Place simulated orders, follow them to settlement and maturity, and read the records they produce. No money or securities move.
Where GetTbill fits, and where it does not
Three kinds of platform sell Treasury bills today. GetTbill is none of them. It lets you read the market and rehearse the decisions first, then you buy elsewhere if you choose.
Buy real Treasury bills
GetTbill: No. Simulation only
- Government portals
- Yes
- Full-service brokers
- Yes
- Cash-account apps
- Yes, usually automatic
Practice without real money
GetTbill: Yes
- Government portals
- Not found
- Full-service brokers
- Not found
- Cash-account apps
- Not found
Curve and rate history charts
GetTbill: Yes, for US bills
- Government portals
- Tables and PDFs
- Full-service brokers
- Partial
- Cash-account apps
- Usually one headline yield
Return after fees beside the quoted rate
GetTbill: Yes, with modeled fees, before tax
- Government portals
- Not found
- Full-service brokers
- Not found
- Cash-account apps
- Often quoted before fees
Ladder planning
GetTbill: Yes
- Government portals
- Not found
- Full-service brokers
- Some providers
- Cash-account apps
- Some providers
Sell before maturity
GetTbill: Simulated
- Government portals
- Often not in the portal
- Full-service brokers
- Yes
- Cash-account apps
- Automatic on withdrawal
Markets side by side
GetTbill: Yes, unranked
- Government portals
- Not found
- Full-service brokers
- Not found
- Cash-account apps
- Rare
Company roles and approvals
GetTbill: Simulated
- Government portals
- Not found
- Full-service brokers
- Partial
- Cash-account apps
- On business-focused apps
Summarized by platform type from public pages of 13 platforms, reviewed 5 November 2026. Features differ between providers and change often. “Not found” means the review found no such feature, not proof that none exists.
Yield comparisons
Markets side by side, deliberately unranked
Figures use different quoting conventions, currencies and credit profiles. Nominal rates are not directly comparable, so this table is not ranked.
- Australia AUDResearch
- ~1m
- 2.69%
- ~3m
- 2.56%
- ~6m
- Unavailable
- ~1y
- Unavailable
Secondary bill yield. Observed May 17, 2013Stale: last observed 2013
- Canada CADData only
- ~1m
- 2.46%
- ~3m
- 2.53%
- ~6m
- 2.77%
- ~1y
- 3.04%
Secondary bill yield. Observed Oct 28, 2026
- Singapore SGDData only
- ~1m
- Unavailable
- ~3m
- Unavailable
- ~6m
- 1.86%
- ~1y
- 1.88%
Secondary bill yield. Observed Nov 5, 2026
- United States USDOfficial data feed
- ~1m
- 3.96%
- ~3m
- 4.10%
- ~6m
- 4.22%
- ~1y
- 4.28%
Coupon equivalent. Observed Nov 5, 2026
| Market | Status | Rate shown | About 1 month | About 3 months | About 6 months | About 1 year | Observed |
|---|---|---|---|---|---|---|---|
| Australia AUD | Research | Secondary bill yieldQuoted as simple yield, /365 | 2.69% | 2.56% | Unavailable | Unavailable | May 17, 2013Stale: last observed 2013 |
| Canada CAD | Data only | Secondary bill yieldQuoted as simple yield, /365 | 2.46% | 2.53% | 2.77% | 3.04% | Oct 28, 2026 |
| Singapore SGD | Data only | Secondary bill yieldQuoted as simple yield, /365 | Unavailable | Unavailable | 1.86% | 1.88% | Nov 5, 2026 |
| United States USD | Official data feed | Coupon equivalentQuoted as bank discount, /360 | 3.96% | 4.10% | 4.22% | 4.28% | Nov 5, 2026 |
4 markets have a data source shown here. 5 more are listed as research with no verified source. Each market’s date is shown, because sources publish on different schedules.
Featured Treasury markets
Three markets with current data
- CanadaData onlyGovernment of Canada2.53%13-week yield, CADObserved Oct 28, 2026Official source, conventions not independently tested
- SingaporeData onlyMonetary Authority of Singapore1.86%26-week yield, SGDObserved Nov 5, 2026Official source, conventions not independently tested
- United StatesOfficial data feedU.S. Department of the Treasury4.10%13-week coupon equivalent, USDObserved Nov 5, 2026Official, conventions verified by test
Market analysis platform
From the quoted rate to the return after fees
A bill’s discount rate is not the return on your money, and a fee can take a large share of a short bill’s return. Change the inputs and follow the arithmetic.
Fee levels are examples from published pricing reviewed in November 2026, not a GetTbill charge. The rate is the official bank discount rate observed Nov 5, 2026. Taxes are not modeled.
- Price per 100
- 98.988889
- You pay
- 9,898.89 USD
- Discount earned
- 101.11 USD
- Quoted discount rate
- 4.00%
- Annual return on your money, before fee
- 4.097%
- Modeled fee for this holding
- 14.81 USD
- Annual return after fee, before tax
- 3.497%
Curve and history
Today’s official curve against any earlier date, with changes in basis points and a rate history for each tenor.
Auction record
Upcoming auctions and published results: high rate, investment rate, price, bid-to-cover and offering size.
Security detail
Each bill’s identifier, dates, denomination and reference rate, plus a table showing how price responds to rate moves.
Provenance
Provider, observation date, retrieval time and a quality label travel with the data, including when it is missing.
13-week bill rate, past year
Official daily bank discount rate
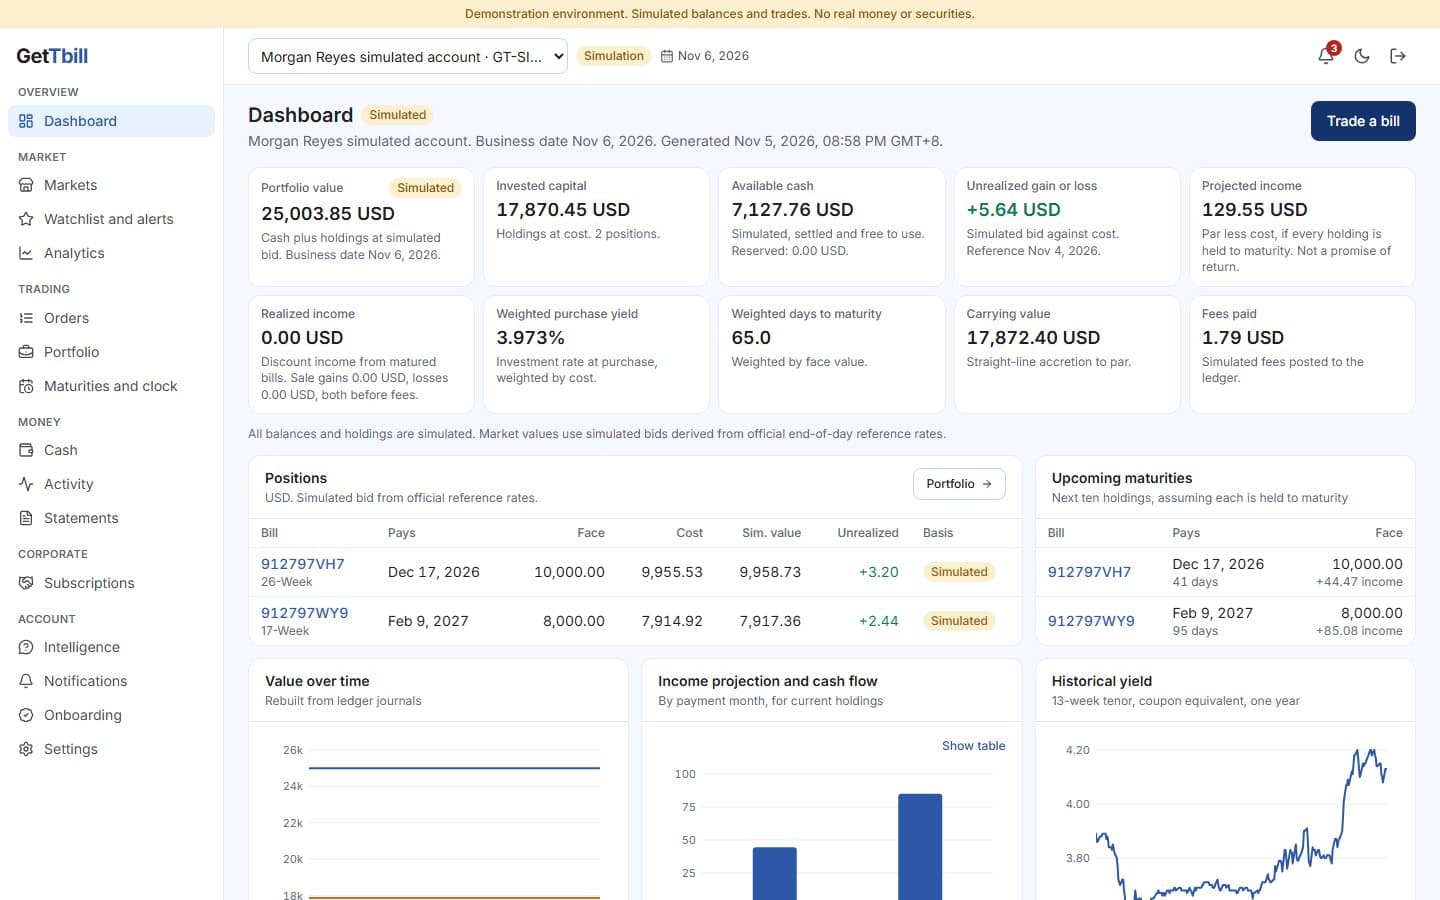
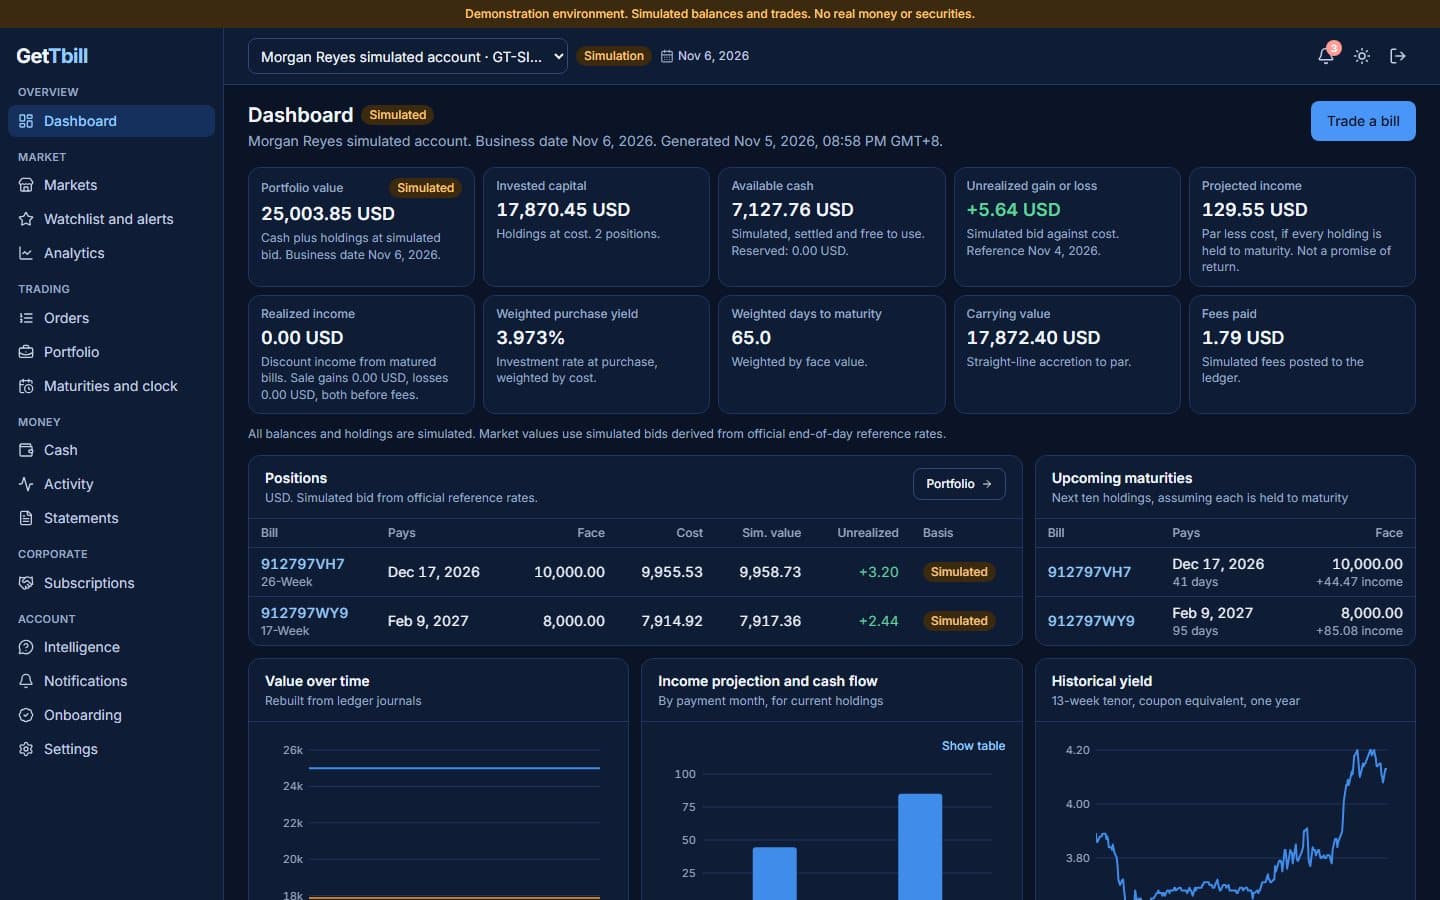
Portfolio management
Practice managing a portfolio, with records you can check
Holdings, orders and statements in a demo account are simulated. The rules that produce them are the ones described in the lessons.
Holdings by lot
Cost basis, accretion toward face value and days remaining for each simulated position.
Order timeline
Every simulated order shows its quote, validation, fill and settlement steps.
Statements
Generate a statement for any period from posted journals and download it as PDF or CSV.
- See portfolio management
Maturity and reinvestment tools
Know when your money comes back
The dates that matter sit on one line, and a ladder reads as cash returning by date.
13-Week bill, next announced auction
Announced
Nov 5, 2026
Terms published
Auction
Nov 9, 2026
Rate set by bidding
Issued
Nov 12, 2026
You pay the discounted price
Matures
Feb 11, 2027
Face value comes back, or rolls
- Calculate price, income and yield for one bill before you commit simulated funds.
- Build a ladder that spreads simulated capital across maturities, in valid increments.
- See when liquidity returns, by date and cumulatively.
- Set a simulated roll instruction so a maturing position buys the nearest same-term bill.
When 100,000 of simulated USD comes back
Simulated- Nov 10, 2026+25,000.00 USD · 25,000.00 USD total
- Dec 31, 2026+25,100.00 USD · 50,100.00 USD total
- Feb 18, 2027+25,200.00 USD · 75,300.00 USD total
- May 13, 2027+25,500.00 USD · 100,800.00 USD total
Simulated planning tool using official reference rates. Prices are not executable. Reference rates observed Nov 5, 2026. This is not a record of real performance.
Security architecture
Controls that exist in the code today
Protected sessions
HttpOnly session cookies, CSRF tokens and rotating refresh tokens that end the session family if one is reused.
Multi-factor sign-in
Authenticator codes with replay protection and single-use recovery codes.
Separation of duties
Sensitive staff actions are requested by one person and approved by a different one.
Tamper-evident audit log
Audit entries are hash-chained, and reconciliation checks that chain alongside the ledger.
What GetTbill is not
- Not a bank, broker-dealer or investment adviser in this demonstration.
- Holds no customer money and no securities.
- Places no real orders. Trades, balances and settlement are simulated.
- Gives no recommendations. Tools explain and compare.
Educational content
Learn the arithmetic behind the numbers
Thirteen short lessons with diagrams and calculators you can change.
FAQ
Questions people ask first
Can I buy real Treasury bills here?
No. GetTbill does not offer or sell securities and cannot place a real bid or order. Orders in a demo account are simulated and never leave the system.
Which parts are real?
US Treasury rates and auction results, and official yields for the markets marked as data connected, come from government publications. They are published data with dates, not live prices.
Which parts are simulated?
Bid and ask quotes, orders, fills, settlement, cash balances, funding, withdrawals, identity checks, maturity payments and statements. No money or securities move.
Why are markets not ranked by yield?
Markets use different quoting conventions, currencies and credit profiles, and no FX data is modeled. A higher nominal rate in another currency is not a higher return, so a ranking would mislead.
Can I lose money on a Treasury bill?
If a US bill is held to maturity and the government pays as promised, it pays face value. If you sell earlier, the price depends on rates at the time, and you can realize a loss. Holding through an intermediary adds that intermediary’s risks.
Demo access
Try it with simulated funds
Create a demo account to build a portfolio against official reference rates. Identity checks, funding, orders and settlement are all simulated, so nothing you do reaches a bank, broker or market.
Contact and support
Questions about the demo or corporate use?
Send us a note about demo access, corporate treasury, partnerships or support. The legal pages and footer show the current status of the operating entity.
Environment: demo. Demonstration environment. Simulated balances and trades. No real money or securities.